
Say you have verified your GA4 tags are firing using Google Tag Assistant. The tag fired, the measurement ID was correct, and no duplicates showed up. But your GA4 reports still show missing events, inflated pageviews, or “(not set)” in key dimensions.
So here’s the thing: if Tag firing is happening, it doesn’t mean the data is right.
Your tag might fire but send incomplete event parameters. It might get blocked by consent mode mid-request. Or the “collect?v=2” packet sent to Google’s servers might be malformed. These issues won’t show up in Tag Assistant because it tells you if a tag fired, not what it sent.
That’s where the Network tab in Chrome DevTools comes in. This guide walks you through exactly how to inspect GA4 data packets, spot errors at the request level, and fix tracking issues before they corrupt your analytics.
Table of Contents
- Introduction
- What is the “collect?v=2” Request and Why It Matters
- How to Open the Network Tab and Find GA4 Requests
- What to Look for in the Network Tab
- Manual Vs Extensions: Decoding GA4 Payloads
- Common Network Tab Errors When Troubleshooting GA4
- Network Tab Workflow to Troubleshoot GA4
- What The Network Tab Tells You (And What It Doesn’t)
What is the “collect?v=2” Request and Why It Matters
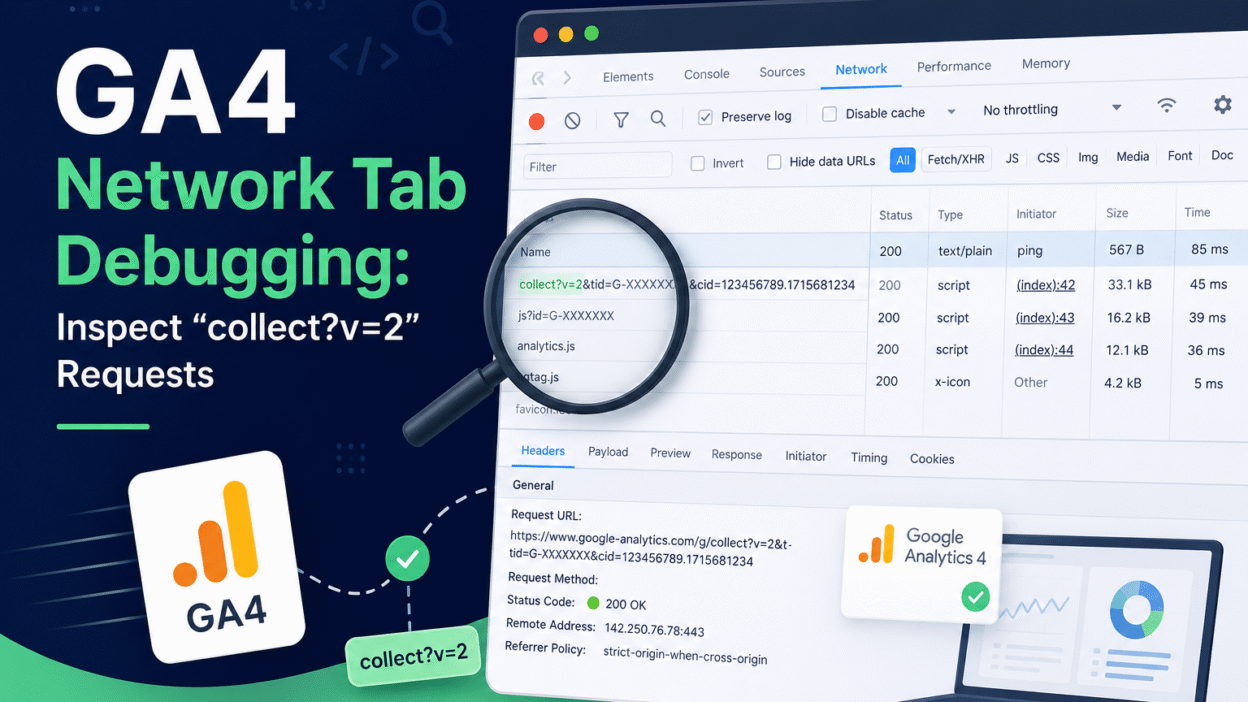
Every time GA4 sends data to Google, it uses the Measurement Protocol with a specific endpoint. Understanding this is essential for troubleshooting GA4 because most tracking errors show up in this request.
The GA4 Collection Endpoint
| https://www.google-analytics.com/g/collect?v=2&tid=GXXXXXXXX&cid=… |
Key Parameters Explained
| Parameters | What it means | Why does it matter |
| v=2 | Protocol version | It confirms that this is GA4 version 2 and not Universal Analytics. |
| tid | Measurement ID | Your GA4 property ID will look like G-XXXXXXXXXX. It identifies which property receives data |
| cid | Client ID | These are unique browser identifiers that link events to the same user across sessions. |
| sid | Session ID | It groups events into sessions for session-level metrics. |
When you see “collect?v=2” in the Network tab, you’re looking at the actual “hit” being sent to GA4 servers. If this request doesn’t fire, or if it’s missing key parameters, your data won’t show up in reports.
What’s Inside the POST Payload
Beyond the URL parameters, the POST body contains:
- event_name: Like page_view, click, purchase, generate_lead
- event parameters: Like page_location, page_title, item_id, value, currency
- user properties: Like user_id, language, first_visit_date
- consent signals: Like analytics_storage and ad_storage status (critical for GDPR/DPDP compliance)
Most troubleshooting GA4 errors appear here: missing event parameters, wrong measurement IDs, or consent blocks that prevent data from reaching Google.
How to Open the Network Tab and Find GA4 Requests
Step 1: Open Chrome DevTools
- Right-click anywhere on your webpage
- Click “Inspect” (or press Ctrl+Shift+J on Windows/Linux or Cmd+Option+J on Mac)
- The DevTools panel opens at the bottom or side of your browser
Step 2: Navigate to the Network Tab
- Click the “Network” tab at the top of DevTools
- Make sure Record is enabled (the red circle icon is solid, not crossed out)
- Check the preserve log so requests don’t disappear when you navigate to new pages
Step 3: Filter for GA4 Requests
- In the filter box at the top, type “collect?v=2.”
- Or filter by domain: “google-analytics.com”
- Refresh the page or perform the action you want to test and search for the GA4 requests in the list.
Step 4: Perform the Action You Want to Test
- For pageviews: Navigate to all the different pages
- For clicks: Click on the button/link you want to track
- For purchases: Go through the checkout flow to the confirmation page
- Look for new “collect?v=2” requests in the Network tab
What to Look for in the Network Tab
When you see requests like “collect?v=2,” click on one to see it in more detail. Here’s what to watch for:
Headers Tab: Request URL, Status Code
- URL request ensure the tid parameter is your GA4 Measurement ID
- Verify the tid parameter matches your GA4 Measurement ID
- Check for the cid parameter (Client ID)
- If you are testing with DebugView on, check for debug_mode=1
Status Code
| Code | What does it mean | What will the action |
| 200 | The request is successful | The data is sent to GA4 |
| 204 | There is no content (success) | The data is sent to GA4 |
| 403 | It is forbidden or blocked | You need to check consent mode or ad blockers. |
| 404 | Not found | The measurement ID is invalid or there is an endpoint issue. |
| Failed | There is network error | Tag got blocked before sending, or there is a connectivity issue. |
Payload Tab: Request Data
Click the Payload tab to view data sent:
For URL encoded parameters (GET requests):
- “en” is the event name (page_view, purchase, etc.)
- “ep” is the event parameters (JSON, urlencoded)
- “ul” is the user’s language
- “sr” is the screen resolution
For “POST” body or “POST” requests:
- event_name: Which event is being sent
- event parameters: page_location, page_title, custom params
- ecommerce data: transaction, items, value, currency
- consent signals: analytics_storage, ad_storage
Preview Tab: Server Reply
If the request is successful, you’ll see Google’s response in the Preview tab. The answer is usually empty (204 No Content) for GA4, which is normal.
Manual Vs Extensions: Decoding GA4 Payloads
Parsing raw POST payloads can be a pain for complex e-commerce events. You have two options:
Manual decode
- In DevTools, open the Payload tab.
- Watch for key parameters: en (event name), ep (event parameters), ul (language)
- Manually decode URL-encoded values (i.e., replace %20 with spaces, etc.)
The downside is that it is very time consuming and prone to human error.
Using extensions (quicker and more accurate)
GA4 requests are automatically decoded by Chrome extensions:
| Extension | Key Features |
| GA4 Network Inspector | It shows event names, ecommerce data, parameters, and consent rules. |
| Felix Febugger – GA4 Network Inspector | It has real-time debugging, request decoding, and validation for analysts and developers. |
| Google Analytics Inspector | It splits the view for client/sGTM, parameter validation, and POST body parsing. |
| Debugger for Google Analytics 4 | It has a browser devtools extension specifically for GA4 event debugging. |
These extensions save you time and minimize human error when you are inspecting complex e-commerce events or custom parameters. They are invaluable for troubleshooting GA4, allowing you to quickly spot missing parameters or malformed data.
Common Network Tab Errors When Troubleshooting GA4
Below are the most common errors you’ll encounter in the Network tab and exactly how to fix them.
| Error | What does it mean | What is the root cause | How to fix it |
| No “collect?v=2” requests | The tag is not firing. | GTM is not published, the tag has a wrong trigger, or gtag.js is not installed. | You can check the Google Tag Assistant first to verify tag firing. |
| 403 Forbidden | The request is blocked. | The consent mode is denying analytics or the ad blocker is blocking requests. | Check the consent First, adjust the consent mode settings, then disable the ad blocker, and then retest. |
| 404 Not Found | The endpoint is invalid. | The measurement ID (tid parameter) is wrong. | You must double-check the “tid” in your tag configuration. |
| Missing “cid” parameter | The client ID is not generated. | The gtag.js or GTM configuration is not initializing properly. | You must check your GA4 configuration setup and verify that gtag.js is loaded before events fire. |
| Empty e-commerce parameters | The purchase data is missing. | The data layer is not pushing the e-commerce data on the thank-you page. | Verify the e-commerce data layer implementation and then check GTM variable configuration. |
| analytics_storage=denied | The consent is not granted. | The consent banner is defaulting to denied, or the user has rejected consent. | Set the default to “granted” if it is allowed and implement the consent update events. |
| Duplicate requests | The tag is firing twice. | There are two GA4 configuration tags on the same page. | Remove the duplicate code: incline and GTM or multiple GTM containers. |
| Missing event parameters | The data is incomplete. | The GTM variable is not populated, or the gtag.js is missing parameters. | Check the data layer in Tag Assistant and verify that the variable names are matching. |
Network Tab Workflow to Troubleshoot GA4
Here is a repeatable workflow that you must follow every time you debug the GA4 tracking:
- First, open the DevTools and go to the Network tab.
- Next, enable “Preserve log” so that the requests don’t disappear when you are going between pages.
- Then, look for “collect?v=2” or “google-analytics.com.”
- Next, trigger the action that you want to test; it can be the page load, click, purchase, or anything you desire to test.
- Then verify the status code. If it is showing 200 or 204, it means success. And if a 403 or 404 shows, it indicates an error.
- Next, you must look at the payload to see if there are any missing parameters or malformed data.
- Then compare the expected data. Check what should be sent and what is actually sent.
- Use extensions like GA4 Network Inspector if manual decoding is too time-consuming
- Cross-reference with Tag Assistant; If Tag Assistant shows tag firing but Network tab shows no requests, check for blocking (consent/ad blocker)
- When you find the document, take screenshots for developers or client handoffs.
What The Network Tab Tells You (And What It Doesn’t)
The Network tab is powerful, but it has limits. Here’s what it does well and when you need to move to the next step in your debugging workflow.
| What network tab shows | What network tab doesn’t show |
| Raw HTTP request details | Whether events arrive in GA4 DebugView |
| Status codes: 200/403/404 | GA4-side processing delays |
| Full POST payload data | Event processing errors on Google’s server |
| Consent mode status in request | Whether data appears in GA4 reports |
| Duplicate requests | User-level debugging across devices |
The Network tab shows whether data is being sent to Google correctly or not. But you need DebugView to verify events actually arrive in GA4 and appear in reports.