
You’ve installed Google Analytics 4 on your website. You may have added the gtag.js code manually, or you may be using Google Tag Manager. But the question is, how do you know the tag is actually firing?
You can’t just assume it’s working. Tracking errors in GA4 happen silently; there are no alerts and no notifications. Your tag might lack the measurement ID, fire twice, or get blocked by consent mode. And if you don’t catch these issues early, your GA4 reports will give you skewed data: inflated pageviews, missed purchase events, or “(not set)” in key dimensions.
That’s where troubleshooting GA4 starts, with Google Tag Assistant.
This guide walks you through exactly how to use Tag Assistant to verify your GA4 tags are firing correctly. You’ll learn how to install it, record a session, read the output, and spot common errors before they corrupt your analytics data.
Table of Contents
- Introduction
- What Is Google Tag Assistant?
- Step-by-Step: How to Install and Connect Tag Assistant
- Reading the Output: Hits, Data Layer, and Errors
- Common Issues Tag Assistant Reveals (And How to Fix Them)
- Pro Tips for Using Tag Assistant Effectively
- What Tag Assistant Tells You (And What It Doesn’t)
What Is Google Tag Assistant?
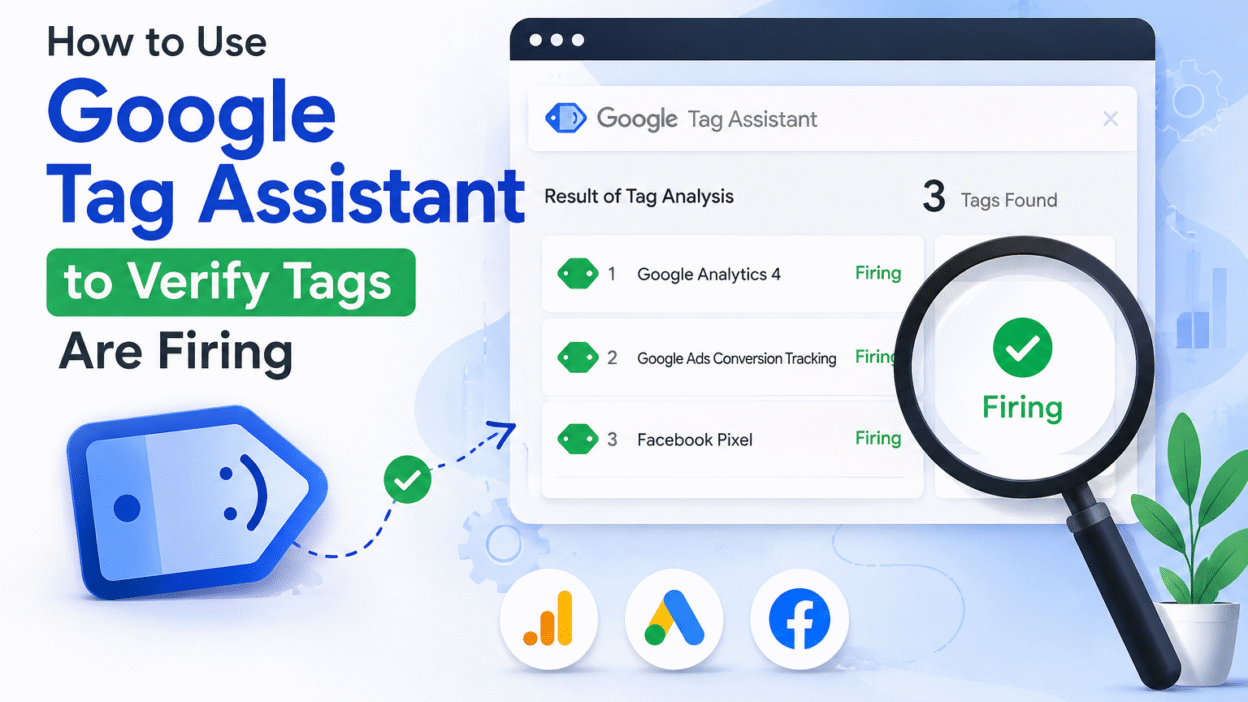
Google Tag Assistant is a Chrome extension that records your browsing session and tells you exactly what Google tags fire on each page, including GA4, Google Ads, and Tag Manager containers.
In 2025 Google combined Tag Assistant Legacy and Tag Assistant Companion into one unified extension. This new version supports both Universal Analytics and GA4 tags and works with both gtag.js and Google Tag Manager implementations.
Key Features
- Real-time recording of page views and tag firings
- Hit details: Shows when tags fire and what data they send
- Error detection: Flags missing Measurement IDs, duplicate tags, or blocked requests
- Data layer inspection: Critical for Google Tag Manager debugging
- Export recordings: Share sessions with developers or clients
Tag Assistant is your first line of defense when troubleshooting GA4 tracking. It tells you whether tags are firing, the foundation for everything else in your debugging workflow.
Step-by-Step: How to Install and Connect Tag Assistant
Step 1: Install the Extension
- Open Chrome and go to the Chrome Web Store
- Search for “Tag Assistant.”
- Add to Chrome → Add extension
- The Tag Assistant icon will be visible in your browser toolbar
Step 2: Link to Your Domain
- Click the Tag Assistant icon in the toolbar
- Type in your website URL (e.g., https://yourdomain.com)
- Click on “Start Recording.”
Tag Assistant will open your site in a new tab and start recording your session
Step 3: Browse and Fire Events
- Click through the various pages you want to test (home page, product pages, checkout)
- Do the actions you want to measure (button clicks, form submissions, purchases)
- Return to the Tag Assistant tab when you’re done testing
Step 4: Stop Recording
- Click “Stop Recording” in the Tag Assistant tab
- The extension will compile all the hits, page views, and data layer events from your session
Reading the Output: Hits, Data Layer, and Errors
Once you stop recording, Tag Assistant will show you a detailed breakdown of everything that happened in your session.
Page Views Panel
On the left side, you’ll see a list of all pages visited:
- Homepage: /homepage/yourwebsite
- Product page: /product/blue-t-shirt
- Checkout: /checkout/confirmation
Click on any page to see which tags fired on that specific page.
Hits Sent Panel
Click a page to view the Hits Sent section. This shows every tag firing:
| Column | What it Shows |
| Tag | GA4 Config, GA4 Event, Google Ads, etc. |
| Timing | When the tag fired (milliseconds after page load) |
| Status | Green means success, yellow means warning, and red means error. |
| Measurement ID | Your GA4 property ID, for example: G-XXXXXX |
Click any hit to expand it and see:
- Parameters: What data was sent (Measurement ID, Client ID, event name, event parameters)
- Request details: URL, payload, consent signals
- Errors: What went wrong (if anything)
Data Layer Panel
For Google Tag Manager implementations, the Data Layer panel is critical.
- Shows all data layer variables pushed during the session
- Displays e-commerce data (items, value, currency)
- Reveals custom dimensions, user IDs, and event triggers
- Helps you verify that GTM is receiving the right data before it fires tags
If your GA4 event isn’t firing but Tag Assistant shows the tag configured correctly, check the data layer; the issue might be that GTM isn’t receiving the data it needs.
Common Issues Tag Assistant Reveals (And How to Fix Them)
Here are the most common tracking errors you’ll spot using Tag Assistant and exactly how to fix them.
| The Issue | What will be visible | What is the root cause | How to fix it |
| Missing measurement ID | GA4 will configure tags without “tid” parameter | The tag is configured incorrectly in GTM or gtag.js | Double-check your measurement ID in GTM config or gtag.js code |
| Duplicate tags | Two GA4 configure tags are firing on the same page | GA4 is installed via inline code and GTM, or multiple GTM containers | Remove duplicate code and keep only one GA4 implementation |
| Tag not firing | No GA4 hits in the session | GTM container not published, or trigger conditions not met | Publish the GTM container and check trigger settings |
| Blocked by ad blocker | No requests sent to Google | Ad blocker or privacy extension blocking GA4 | Test in incognito mode with ad blockers disabled |
| Consent mode blocking | analytic_storage=denied in request | Consent banner denying analytics by default | Verify consent mode defaults and implement consent update events |
| Wrong event name | Event firing but wrong event_name | Tag configured with incorrect event name | Check GTM trigger or gtag.js event parameter |
Pro Tips for Using Tag Assistant Effectively
- Test in Incognito Mode
Ad blockers, privacy extensions, and browser tracking prevention can block GA4 requests. Always test in:
- Incognito/Private mode (no extensions by default)
- With ad blockers disabled (if you have them installed)
This way, you’re testing your implementation, not your browser’s privacy settings.
- Record Different Flows Separately
But don’t test the homepage. Record separate sessions for:
- Browsing flow: Homepage → Product page → Category page
- Conversion flow: Add to cart → Checkout → Purchase confirmation
- Form submission: Landing page → Form fill → Thank you page
Each flow may have different tags firing, and you want to check them all.
- Identify Gaps with Comparative Pages
Compare pages to see why some don’t send data to GA4:
- Open Tag Assistant and go to Page A and view which tags fire
- Open Tag Assistant and go to Page B and determine whether tags are missing
- This allows you to understand why you’re not tracking certain pages
- Share Recordings as Reports for Client Handoffs
Tag Assistant allows agencies and consultants to export recordings as reports. This is perfect for:
- Sharing troubleshooting findings with developers
- Documenting fixes for clients
- Training team members on GA4 debugging
What Tag Assistant Tells You (And What It Doesn’t)
Tag Assistant is powerful, but it has limits. Here’s what it does well and when you need to move to the next tool.
| What tag assistant shows | What tag assistant doesn’t show |
| Whether tags are firing | Raw HTTP request details |
| Timing of tag firings | Full POST payload data |
| Missing measurement IDs | Consent mode status in detail |
| Duplicate tags | Whether events arrive in GA4 DebugView |
| Data layer variables | Network status codes (200/403/404) |
The bottom line is that Tag Assistant tells you if tags are firing. But to inspect the actual data packets that Google sends, you need the Network tab in Chrome DevTools.